

Life is a series of trade-offs. One of the hardest is how much money to put aside for a future that is, by definition, uncertain. Save too little, and risk an inadequate standard of living in later life. Save too much, and you’ve sacrificed your present-day financial heath in the interest of having more than you need when you retire.
Recently, there has been much debate about how the pensions system can be improved to help people solve this challenge. In particular, it’s been proposed that the default contribution rates within the workplace pensions system should be increased.
Much of this debate has been framed purely in terms of what contribution rate will get people to an ‘adequate’ level of retirement income, where ‘adequate’ is defined by a range of different measures. At Nest Insight, we’ve been concerned that this fails to take into account people’s wider financial resilience in the present day.
Ideally, contribution rates would be set in a way that takes into account people’s spending power throughout their working lives and into retirement. That’s why we’re so pleased that, over the past year, Phoenix Insights has been supporting us in an innovative piece of modelling work which we believe provides an important new perspective on the ‘pensions adequacy’ question.
No two households are the same
When it comes to setting pension contribution rates, one rate will never be right for everyone. The make-up of households differs greatly, as do the specific financial risks and vulnerabilities that they face. The cost of their housing can vary from zero, for those who own outright, to a very high percentage of household income. And people have varying contribution histories that aren’t usually visible to the people running their current pension arrangement.
The upshot is that two individuals who earn the same from their work can have very different savings priorities. Of course, in an ideal world, everyone would override the default rate at which they’re enrolled, and choose their own bespoke levels of contributions. Yet as we’ve seen in other research, defaults become destiny for many people. The rate at which someone is enrolled is usually the rate at which they continue to contribute, through thick and thin.
This puts an onus on policy makers and employers – or anyone deciding on a default contribution rate. They need to do this in a way that maximises good outcomes for the greatest possible number of people, but also avoids putting additional burdens on those who are already less financially resilient.
So, given the diversity of people’s financial lives, how can anyone decide on a contribution rate – or a set of rates – that meet the needs of the greatest possible number of people? Although we don’t claim to have a magic formula, we hope we’ve helped inform this decision by asking what would be the optimal rate for each of thirty ‘saver personas’ that we’ve created in our new household model.
Introducing our saver personas
Our saver personas are fictional, but realistic, individuals, whose households and incomes reflect the diverse lived experiences of real working-age adults in the UK. We created them using data from the Understanding Society household panel study. We then used statistical modelling techniques to project their incomes and expenses throughout their working lives. Based on this, our model can also work out what their incomes will be in retirement, based on the rate at which they contribute to a pension.
To help explore the financial trade-offs involved in retirement savings, we worked out the disposable incomes of our personas’ households, taking into account the cost of housing at each stage of their lives. We then asked our model to set contribution rates that would do two things at once:
- smooth their spending power across their working lives and into retirement
- keep their disposable incomes above established living standard benchmarks.
Our model necessarily makes a number of simplifications and assumptions, so the contribution rates it recommends are not the best possible options for each and every individual. It’s also important to bear in mind that the model has perfect information about the entire life course of each of our personas, which nobody has in reality. Still, these recommendations do throw into clear relief the savings trade-offs facing people in these kinds of circumstances.
Here are three of the lessons we’ve learned, illustrated with examples from our family of personas. To learn more about all 30 personas, and to get more detail on what we’ve learned from them, please see our report, How much is enough, produced in partnership with Phoenix Insights.
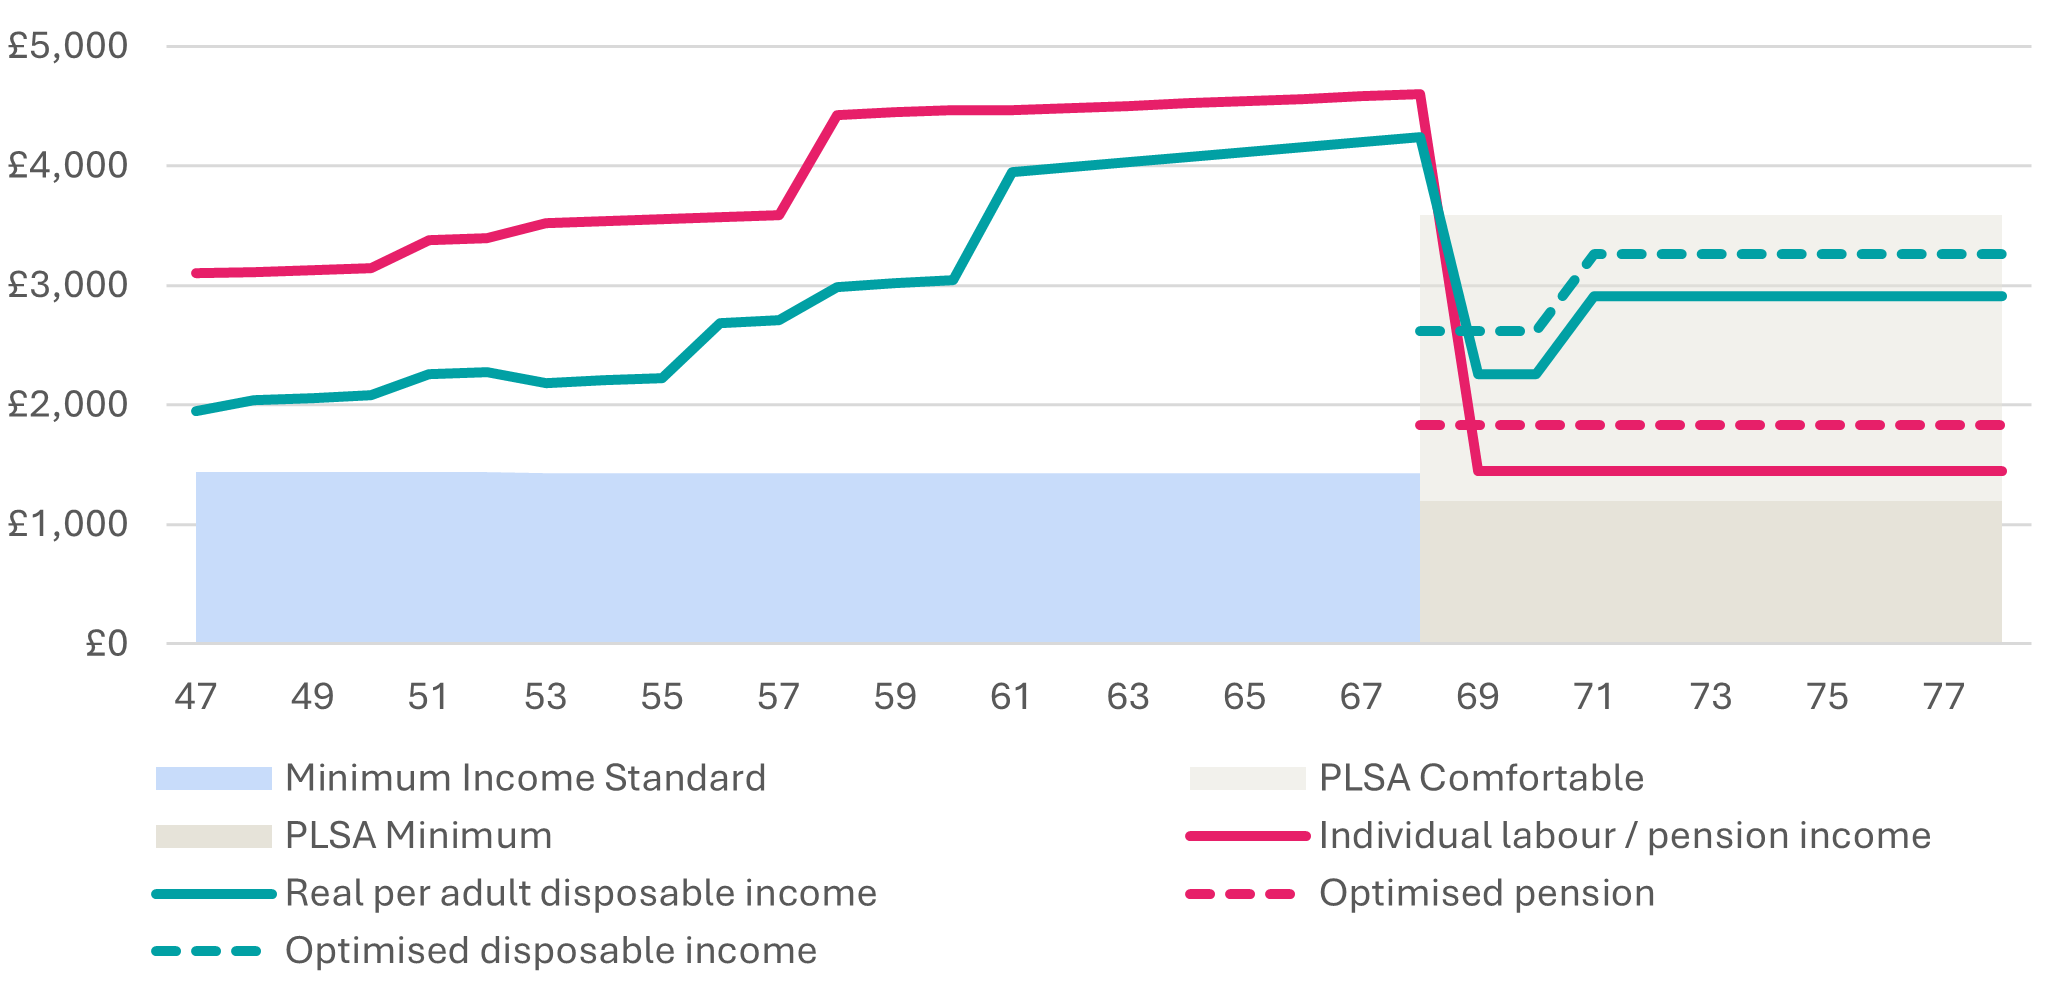
Above-median earners can face sudden drops in spending power at retirement. But they may have other ways to fill these gaps.
Saver persona 16 illustrates the fact that above-median earners can generally afford to contribute more and would benefit from contribution rates that are higher than the current minimum AE rates. However, these rates should probably not be set at levels designed to deliver a target replacement rate through pensions saving alone. As is the case for persona 18, higher earners are more likely to get some of their retirement income from non-pension sources.
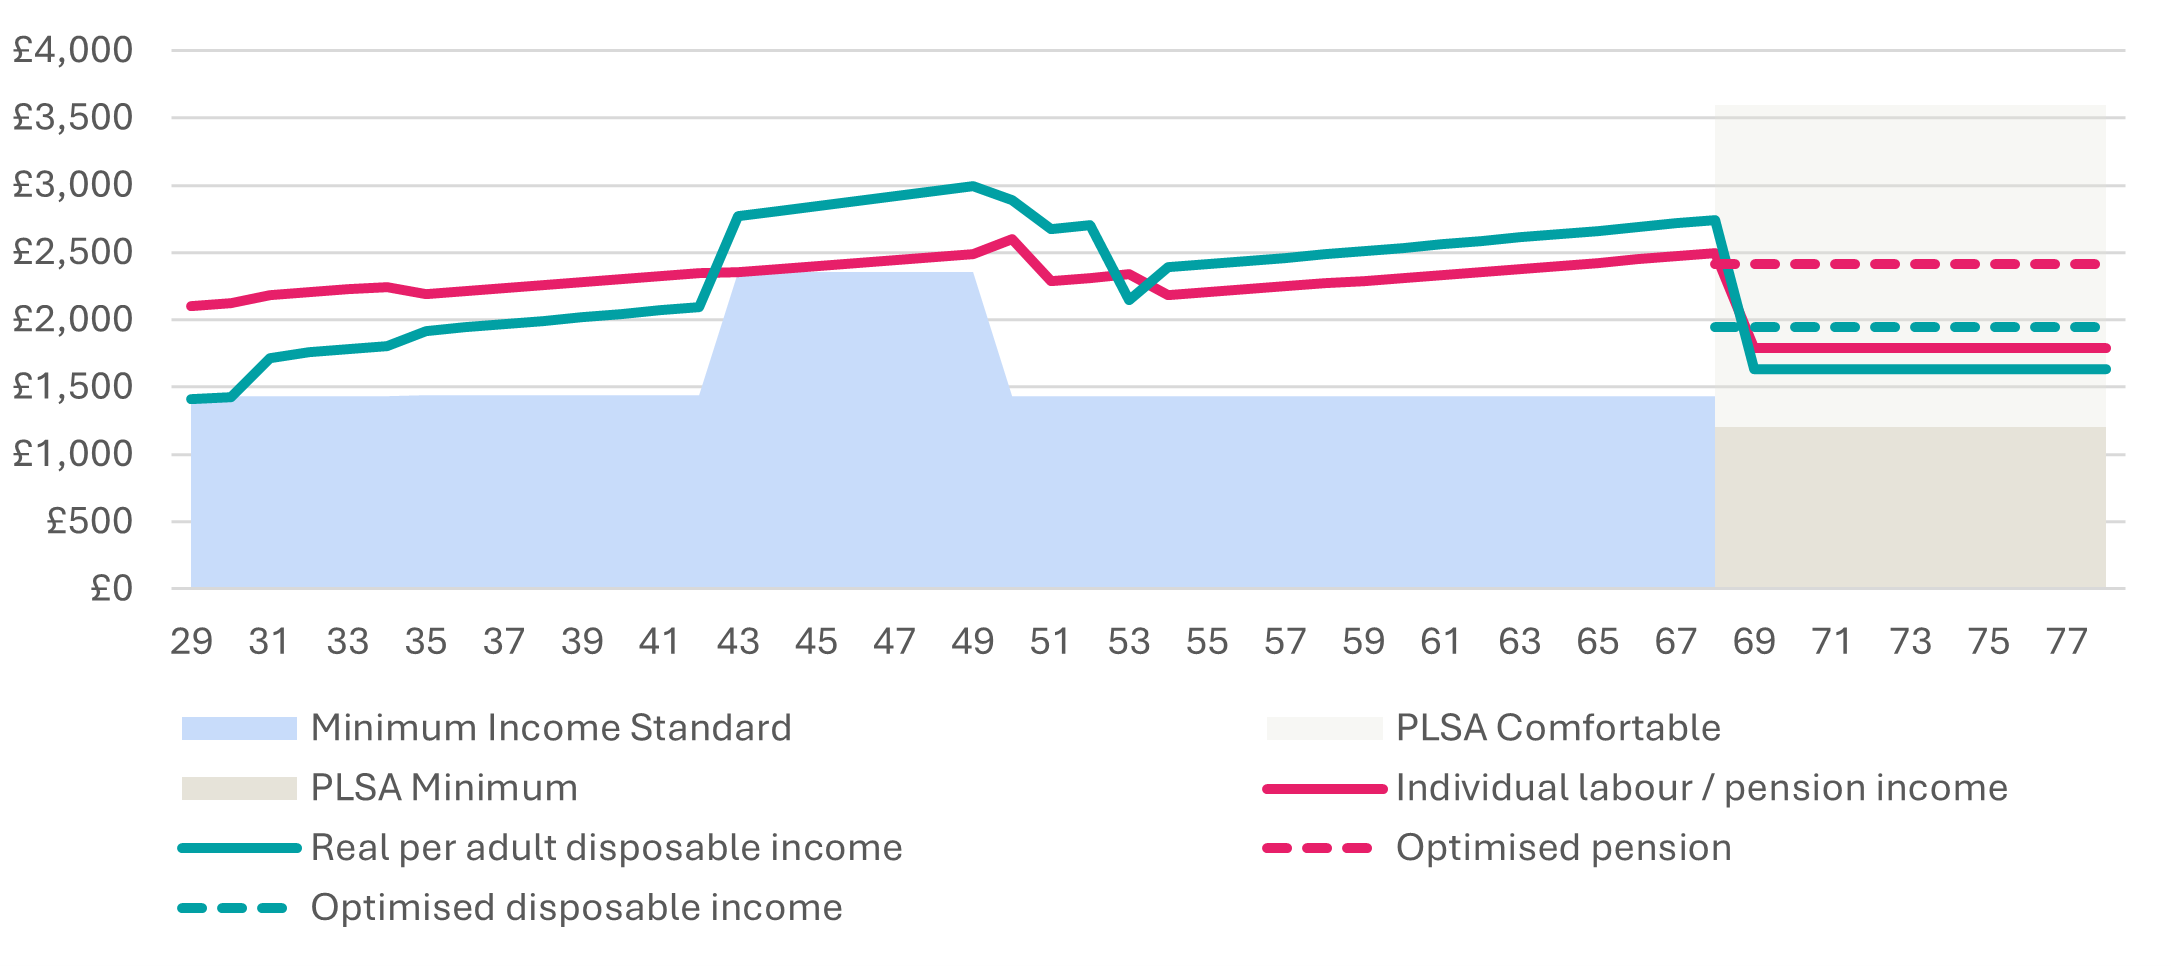
People earning just below the median would benefit from saving more, but their priorities depend on the make-up of their households
Our model wants persona 16 to save more, and it recommends a total contribution rate of 15%. This assumes her husband continues to contribute at the minimum rate. Alternatively, they could both contribute closer at a rate that’s closer to the 12% recommended by a number of industry stakeholders. This is an example of how people earning around the median wage, or a little below this level, can have the capacity to smooth their lifetime spending power by contributing at a higher rate than the current auto-enrolment minimum.
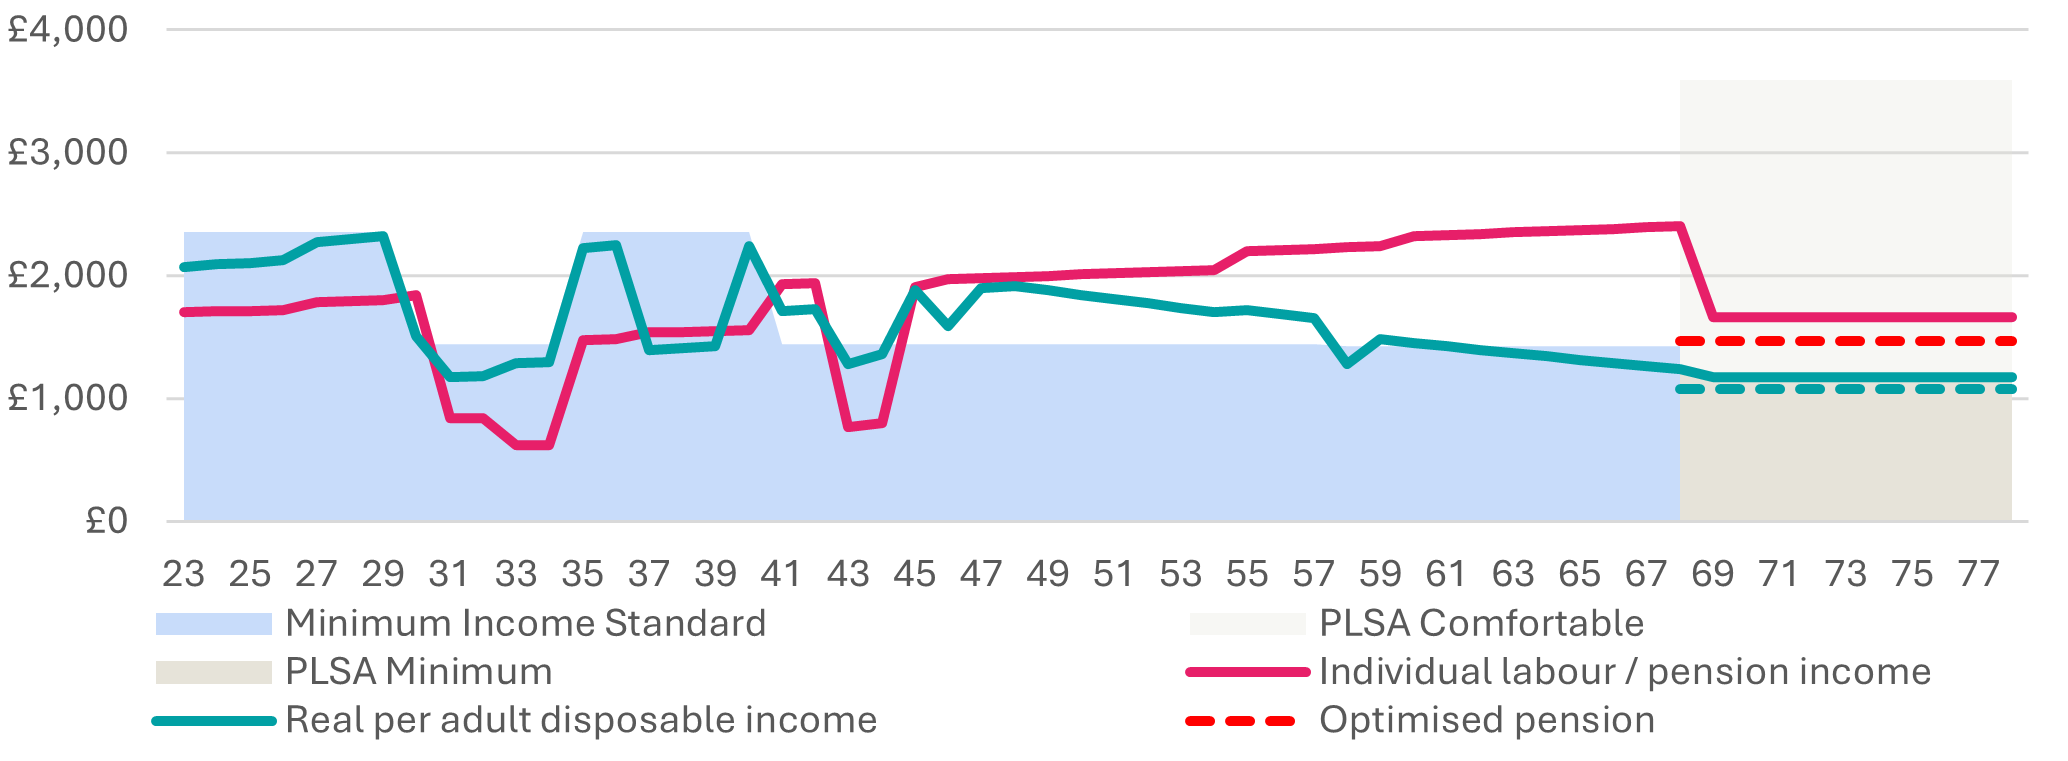
People earning below the national living wage can face financial pressures in the present that make it less clear-cut they should contribute more for the future
Saver persona 2 is an example of the financial risks and challenges facing those earning less than £2,000 a month. This means tougher trade-offs between short and long-term priorities. But it’s important they keep saving towards an adequate retirement income. So there’s a case to say that lower earners shouldn’t have to drop out of the private pension system at times when financial pressures make them reduce or stop their contributions.
Note
The lines on the charts show:
- Pink solid line: gross income – from work up to age 68, and after this, pension income. This is based on them contributing at current default AE rates. Pension income includes the full State Pension.
- Pink dotted line: pension income if they instead contribute at our model’s recommended rates.
- Teal solid line: average disposable income per adult in the household if they contribute at current default AE rates, net of housing costs.
- Teal dotted line: average disposable income in the household if they contribute at our model’s recommended rates.
- Blue shaded area: the Minimum Income Standard for this individual, excluding housing costs.
- Dark grey shaded area: The Pensions and Lifetime Savings Association’s Minimum Retirement Living Standard for an individual.
- Light grey shaded area: The Pensions and Lifetime Savings Association’s Comfortable Retirement Living Standard for an individual.
For more detail on all the data shown in these lifetime income charts, please see the How much is enough? report.


